Copyright©2004 by Daniel B. Sedory
A
Simple Console Program Example
(with instructions):
A very simple Console program, Simply.exe: SimplyC.zip [with the "C" source code and my MAKEsimply.cmd Batch file; Note: This .CMD "MAKE" file (as we're calling it) has nothing to do with Borland's Make program and its own makefiles! We will, however, be commenting on those later.] Here's a screenshot of what the .CMD (Batch) program will display when compiling and linking simply.c into simply.exe (the program):
|
Building simply.exe ... Borland
C++ 5.5 for Win32 Copyright (c) 1993, 2000 Borland Link Successful; you still need to test your program! Press any key to continue . . . |
If all goes well, just press a key and the window disappears! Now go ahead and try it yourself! When you look in whatever folder you made for the program files (e.g., C:\bc55\test\simply\) you should now see the following files:
|
MAKEsimply.cmd |
1,241
bytes 948 bytes 53,760 bytes 276 bytes 1,615 bytes 393,216 bytes |
You started with only the first two files listed above. The .obj file was created by the compiler (bcc32) from the .c file, and the .exe file (the program) was created by the linker (ilink32). The Map file is a simple table that shows where a few general parts (like the code and data sections) can be found in the executable; you can keep a Map file from being created by adding a /x to the end of the linker line in my Cmd make program!
|
Helpful
HINT: Install the Win2000/XP "Power Toy" that allows
you to open a Command-Line (.CMD) window
at any folder by simply right-clicking on the folder name in Windows Explorer
and selecting "Command Prompt Here" from the menu. You'll probably
find a lot more use for .CMD and Batch files after doing this! Direct
Link: |
When you run simply.exe (you'll need to open a Command Prompt window first), its output should look like this:
|
Console Programs for Windows 2000/XP/2003 can |
If the program's "C" source code is completely foreign to you, I recommend that you still try to work through this page and compile the programs. Once you start reading Bruce Eckel's free book, Thinking in C++ (which includes a chapter on C coding), you'll be able to return here for a quick review in order to compile/link the examples in his book.
The .tds
file (by far the largest one) is always created by the Borland linker;
whether you need it or not. It contains most of the data necessary to debug
the program, but will be unable to do so unless the proper
switches* are set for both
the compiler and the linker! In our Cmd make file for Simply,
we asked both the compiler (using the -v
switch) and the linker (using /v)
to add debug information to its .tds file; allowing us
to debug the program in Borland's Turbo Debugger for
Windows.
Depending upon which command-line has the "v" switch
missing, TD32 will show a couple different error messages. As an exercise,
you should go through the make process: 1) first without one switch,
2) only without the other and then 3) without both of them to see how TD32
acts when you try to debug simply.exe!
_____________
* You
can find very detailed information about every switch and
option for both the compiler and linker in the HELP file, bcb5tool.hlp,
found in your C:\bc55\Help\
folder!
Using Borland's Turbo Debugger
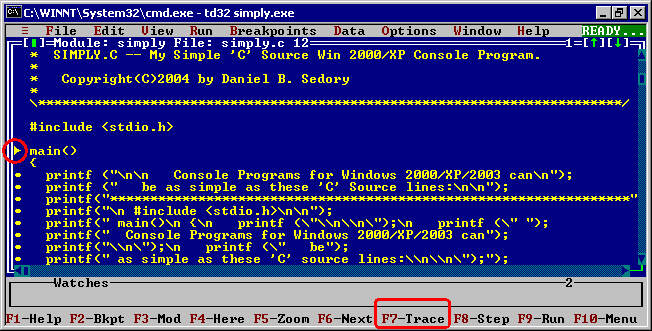
Entering td32 simply.exe at the Command-line prompt for your SIMPLY test folder, will change the window into something like this:

And if you look at the OS's TASKBAR, you should see that yet another window has opened up! The second window is for showing the output of the program while debugging it. If you have an 800x600 (or larger) display setting, you should be able to see most if not all of both windows at the same time! Now look for a little yellow arrowhead along the left-side of the first window (there's a red circle around it in the pic above). That shows which line of source code is about to be executed. Pressing the F7 key will execute one line of code and advance the little arrow down one line each time you press F7; but it will skip any lines that do not have a thick yellow dot on them. Press F7 twice then look at the second window. It should now look like this:

If you continue
pressing the F7 key, you'll end up running through the whole program;
after executing any code that ends the program, the second window will
disappear. Then you'll see a message box that states, "Process terminated."
Press the ENTER key (or click on the OK button in full-screen),
to remove the message box.
{ NOTE: If you press the ALT plus
ENTER keys while this window is in focus, it will become full-screen,
and you'll be able to use the mouse (with a rectangular-shaped
cursor). }
If you open the "Run"
menu and select "Program reset"
or just press the CTRL plus F2 keys, you'll be able to
debug the program again without having to quit TD32. Go ahead
and do that now. Although
Turbo Debugger has its own built-in Help, it's a bit more difficult to find
answers in it than in a Windows Help file. Select "Help
on help" from the "Help"
menu and note the keys that will help you navigate through the Help panes; while
there, select the topic "Breakpoints" and learn how to set a breakpoint
on one of the code lines. Unless you alter it, a simple breakpoint defaults
to the "action" of break and the "condition" of always.
Now set a breakpoint on one of the code lines and "Run"
the program by pressing the F9 key! The program should halt before executing
the instruction on that line. You can Quit
Turbo Debugger at any time by pressing the ALT plus X keys!
Here's another little C program which lists all 256 of the ASCII characters in Hex and Decimal: CHARTYPE (.zip; 37KB) with a pre-compiled 32-bit version that's been compressed by UPX.
Exercise: Make a copy of the file MAKEsimply.cmd from above and change the file name to: MAKEchartype.cmd. Replace each occurance of the word "simply" (5 of them) in this new file with "chartype" then execute it in a separate directory containing the file chartype.c. If you see a message stating: "Warning W8080 CHARTYPE.C 172: '_getch()' is declared but never used" don't worry about it; that's because the program never uses a character from the "getch()" function. It's just a tricky (and perhaps sloppy) way we used to get the program to wait until a key is pressed. You should always search the Net and forums for the best way to carry out a procedure when writing a program for a client.
After checking the new executable (its size should be 58,368 bytes), run the program under Turbo Debugger. If you can, make sure to place both windows on your Desktop in a way that allows you to see the program output while running the debugger!
During its execution (using the F7 key), you'll get an idea of how the program operates. Make sure you trace through (F7) each of the program's defined functions [dispchars() and lastline()] so you can see how a function (subroutine) can save both space and a lot of time coding. Then use the F8 key to step over* [execute each function without leaving the main() program sequence] them.
Note: It's possible to modify the code in CHARTYPE so that it will only recognize a single type of keypress (such as the ENTER key) before continuing. Little routines such as that are the kind of code you'll use over and over again and may even add to a library of functions you'll use for a large project.
_______________
*In Microsoft's
DEBUG.EXE program, the "t" or "p" keys are
used respectively to trace through (step into) or
proceed (step over) any subroutines in the Assembly
code. It's my opinion that Borland's decision to use the word "Step"
next to the F8 key on the bottom of the display window might confuse
some students!
 Back
to The Starman's Realm Index page!